Deck: We pressure‑tested SoL/MVS against fresh field context, tightened the math, and finalized a single pass/fail Interface‑Heartbeat experiment with μW–mW targets. (Jezero was already in Part 1; this post adds Lappajärvi, oxygenation, and the full SOP.)
TL;DR
- Jezero (recap from Part 1) + Lappajärvi strengthen the real‑world battery wall and crucible/clock anchors.
- The oxygenation result is gradient architecture context—no mechanism change.
- Interface‑Heartbeat SOP (wall reactor) is ready: show S‑curve + exotherm + currencies in one run.
Cheat‑sheet: Battery + Clock + Container + Mix → Autocatalysis → Templated copying → Evolution.
Why this experiment is decisive (closes the loop)
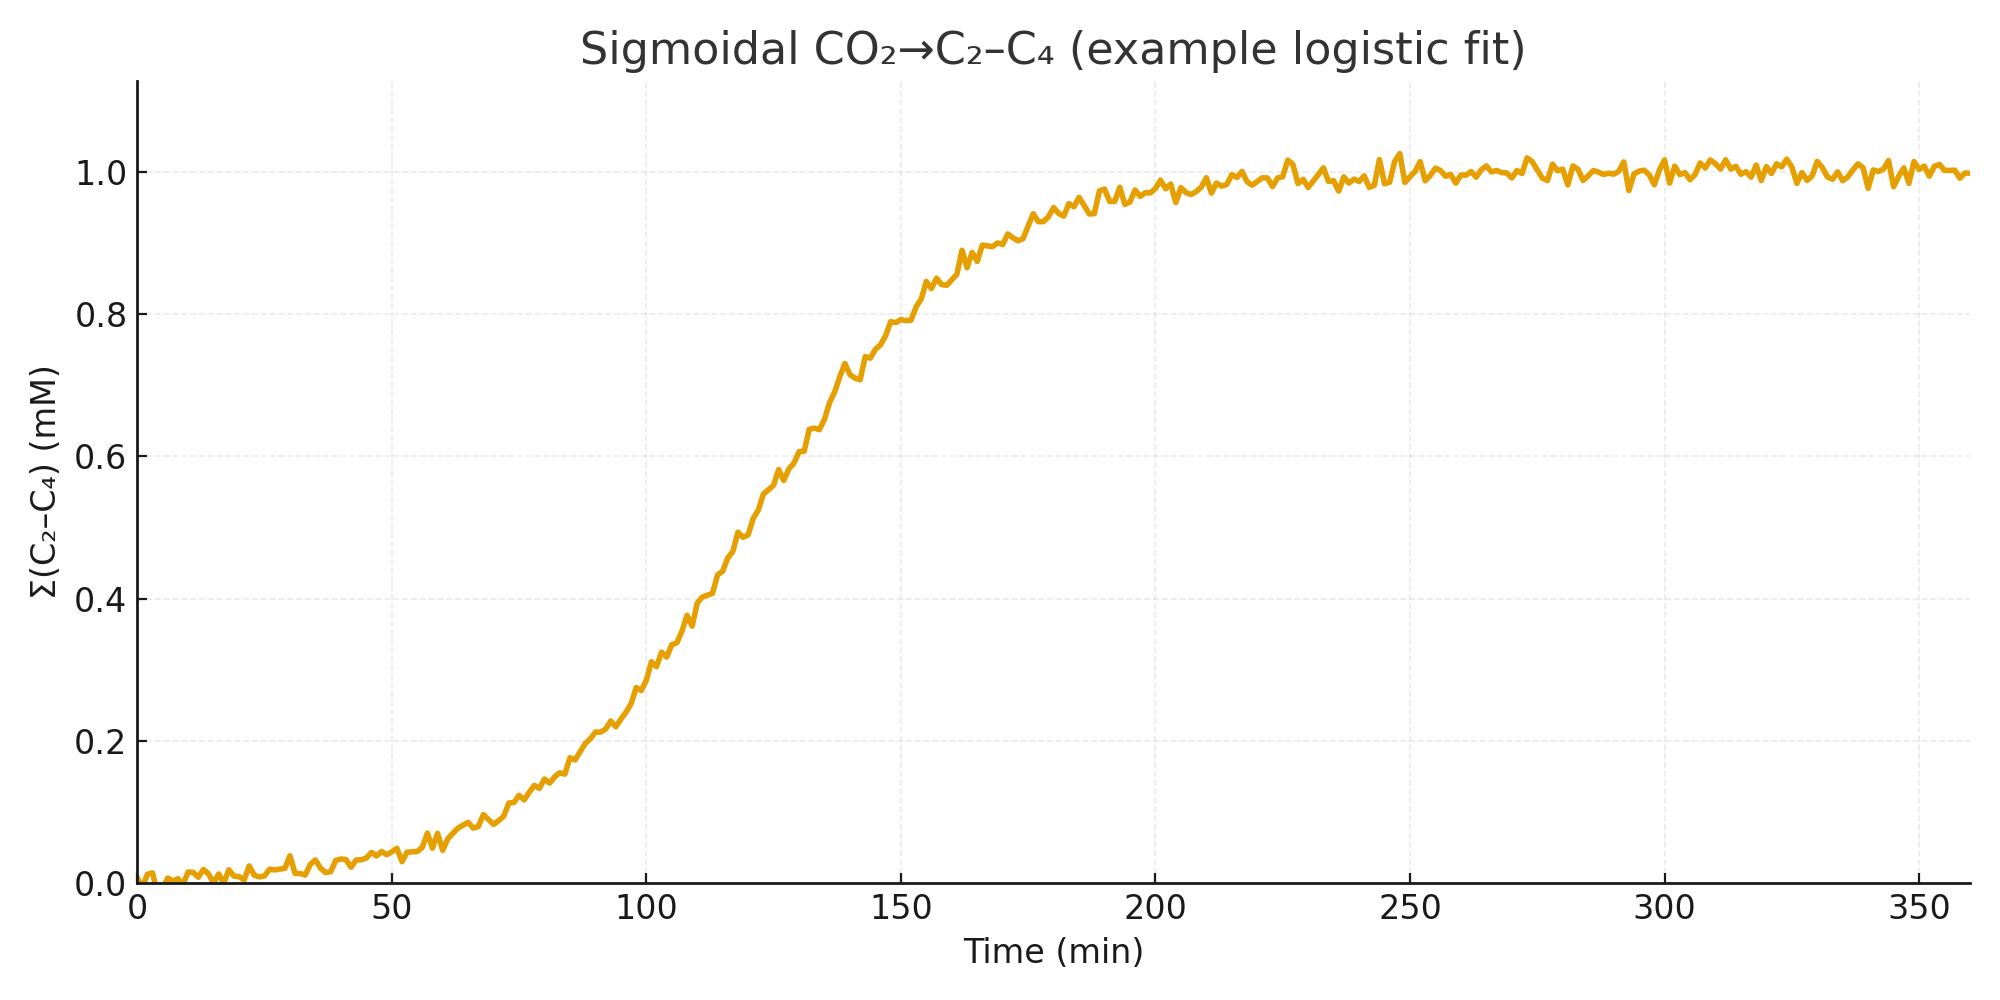
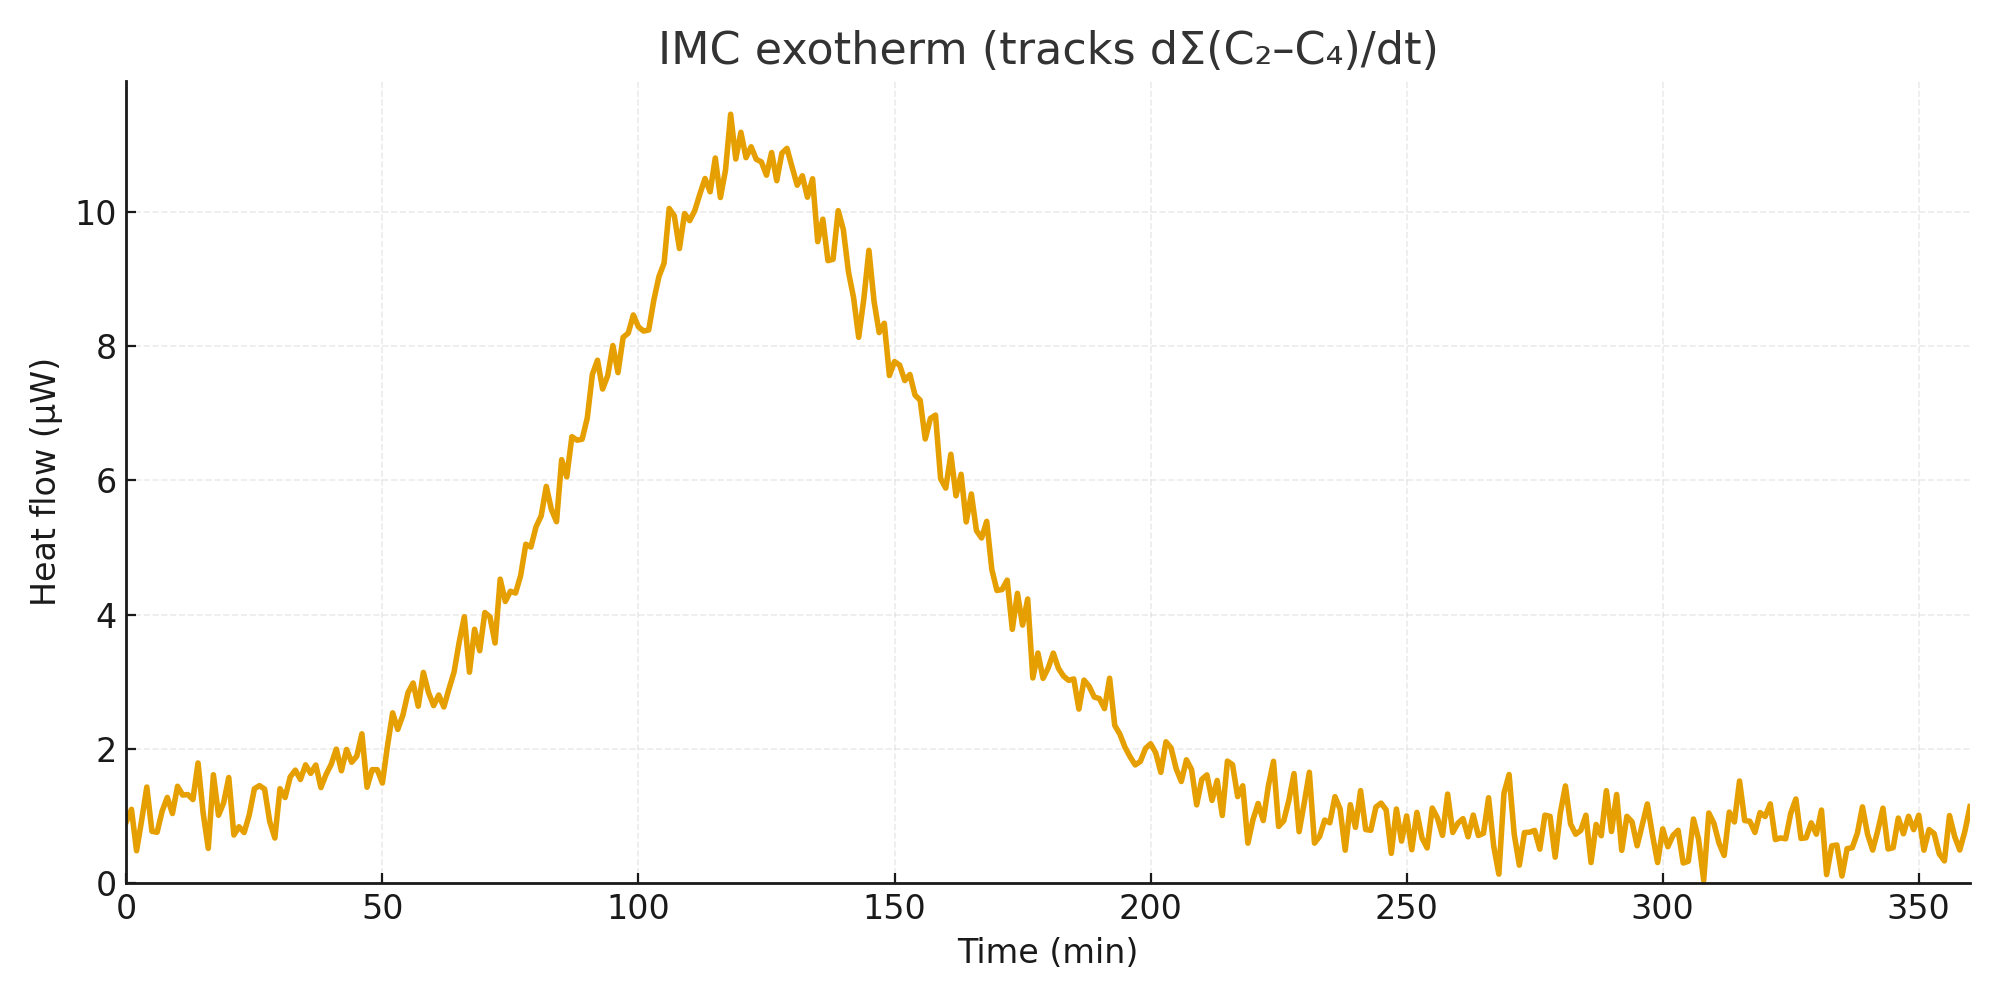
One wall, four receipts. At a single FeS core / Fe-phosphate rim—the same mineral pairing reported at redox fronts in Jezero-style rocks—we look for four co-registered signals: a sigmoidal product rise (slow → takeoff → plateau), a matching heat release in the microcalorimeter, small ΔpH/ΔE bumps across the wall, and formation of energy currencies (AcP/PPi). Each exists on its own in the literature; seeing them together at one interface means the wall is doing sustained, self-amplifying work (autocatalysis), not a one-off spike.
Pass/fail, not vibes. Thresholds are pre-published—fit quality (Σ(C₂–C₄) logistic beats linear/mono-exp by ΔAIC ≥ 10), coupling (IMC heat ↔ dΣ(C₂–C₄)/dt cross-corr ≥ 0.6; lag ≤ 5 min), label (required: [1,2-¹³C] acetate in a ¹³CO₂ run), and currencies (AcP or PPi ≥ 3σ above blank; ³¹P-NMR primary ID; Raman/enzymatic confirm). If a control shows the coupled pattern, or the wall run doesn’t, the model fails.
Energy accounted in watts. Standard reaction heats convert “moles made” to μW–mW targets above instrument floors. Logistic vs linear changes the shape of the trace, not the total heat.
Minimal set, closed. With Battery + Clock + Container + Mix in place, carbon is pushed uphill to C₂–C₄ and currencies, and the wall feeds back on itself—the step from ingredients to a self-driving chemical engine.
What changed since Sept 14
Note: Our Sept 14 post already incorporated the Jezero result. Since then we have integrated:
- Aug 27 — Oxygenation (Nature): staged O₂ rise → planet‑scale gradient architecture context.
- Sept 17 — Lappajärvi (Nat. Commun.): impact‑hydrothermal system with long‑lived cooling stages and fracture porosity; first colonization window at ~47 °C → robust container + clock analog (not abiogenesis).
- Sept 18 — Tools: Interface‑Heartbeat Targets & Calculator + IMC Math & Signal Budget posted (checked enthalpies; μW→mW scenarios in 1–20 mL cells).
Field anchors (how they fit SoL/MVS)
Jezero (recap) = geometry & battery. The greigite↔vivianite pair defines an Fe‑S/P front—our predicted porous, conductive wall for H₂/CO₂ work at low T. We treat biogenicity as open; the front physics (minerals + geometry) anchors the model.
Lappajärvi = crucible & timescales. Impact‑hydrothermal systems supply gradients, pores, and mixing over Myr windows at moderate temperatures. That’s an excellent natural analog for the Container + Clock we use in the recipe.
Oxygenation = background gradients. Stepwise O₂ reshapes planetary redox architecture. Our tests live at local interface scale and should operate within many such backgrounds.
Mechanistic spine (unchanged)
Battery + Clock + Container + Mix → Autocatalysis → Templated copying → Evolution
No miracle step. Just four inputs, then the kinetics take over.
The decisive experiment: Interface‑Heartbeat (single dataset)
Goal: In one FeS‑core / Fe‑phosphate‑rim wall reactor, co‑register
(i) a sigmoidal CO₂→C₂–C₄ product curve and
(ii) a matching IMC exotherm from the same wall, while
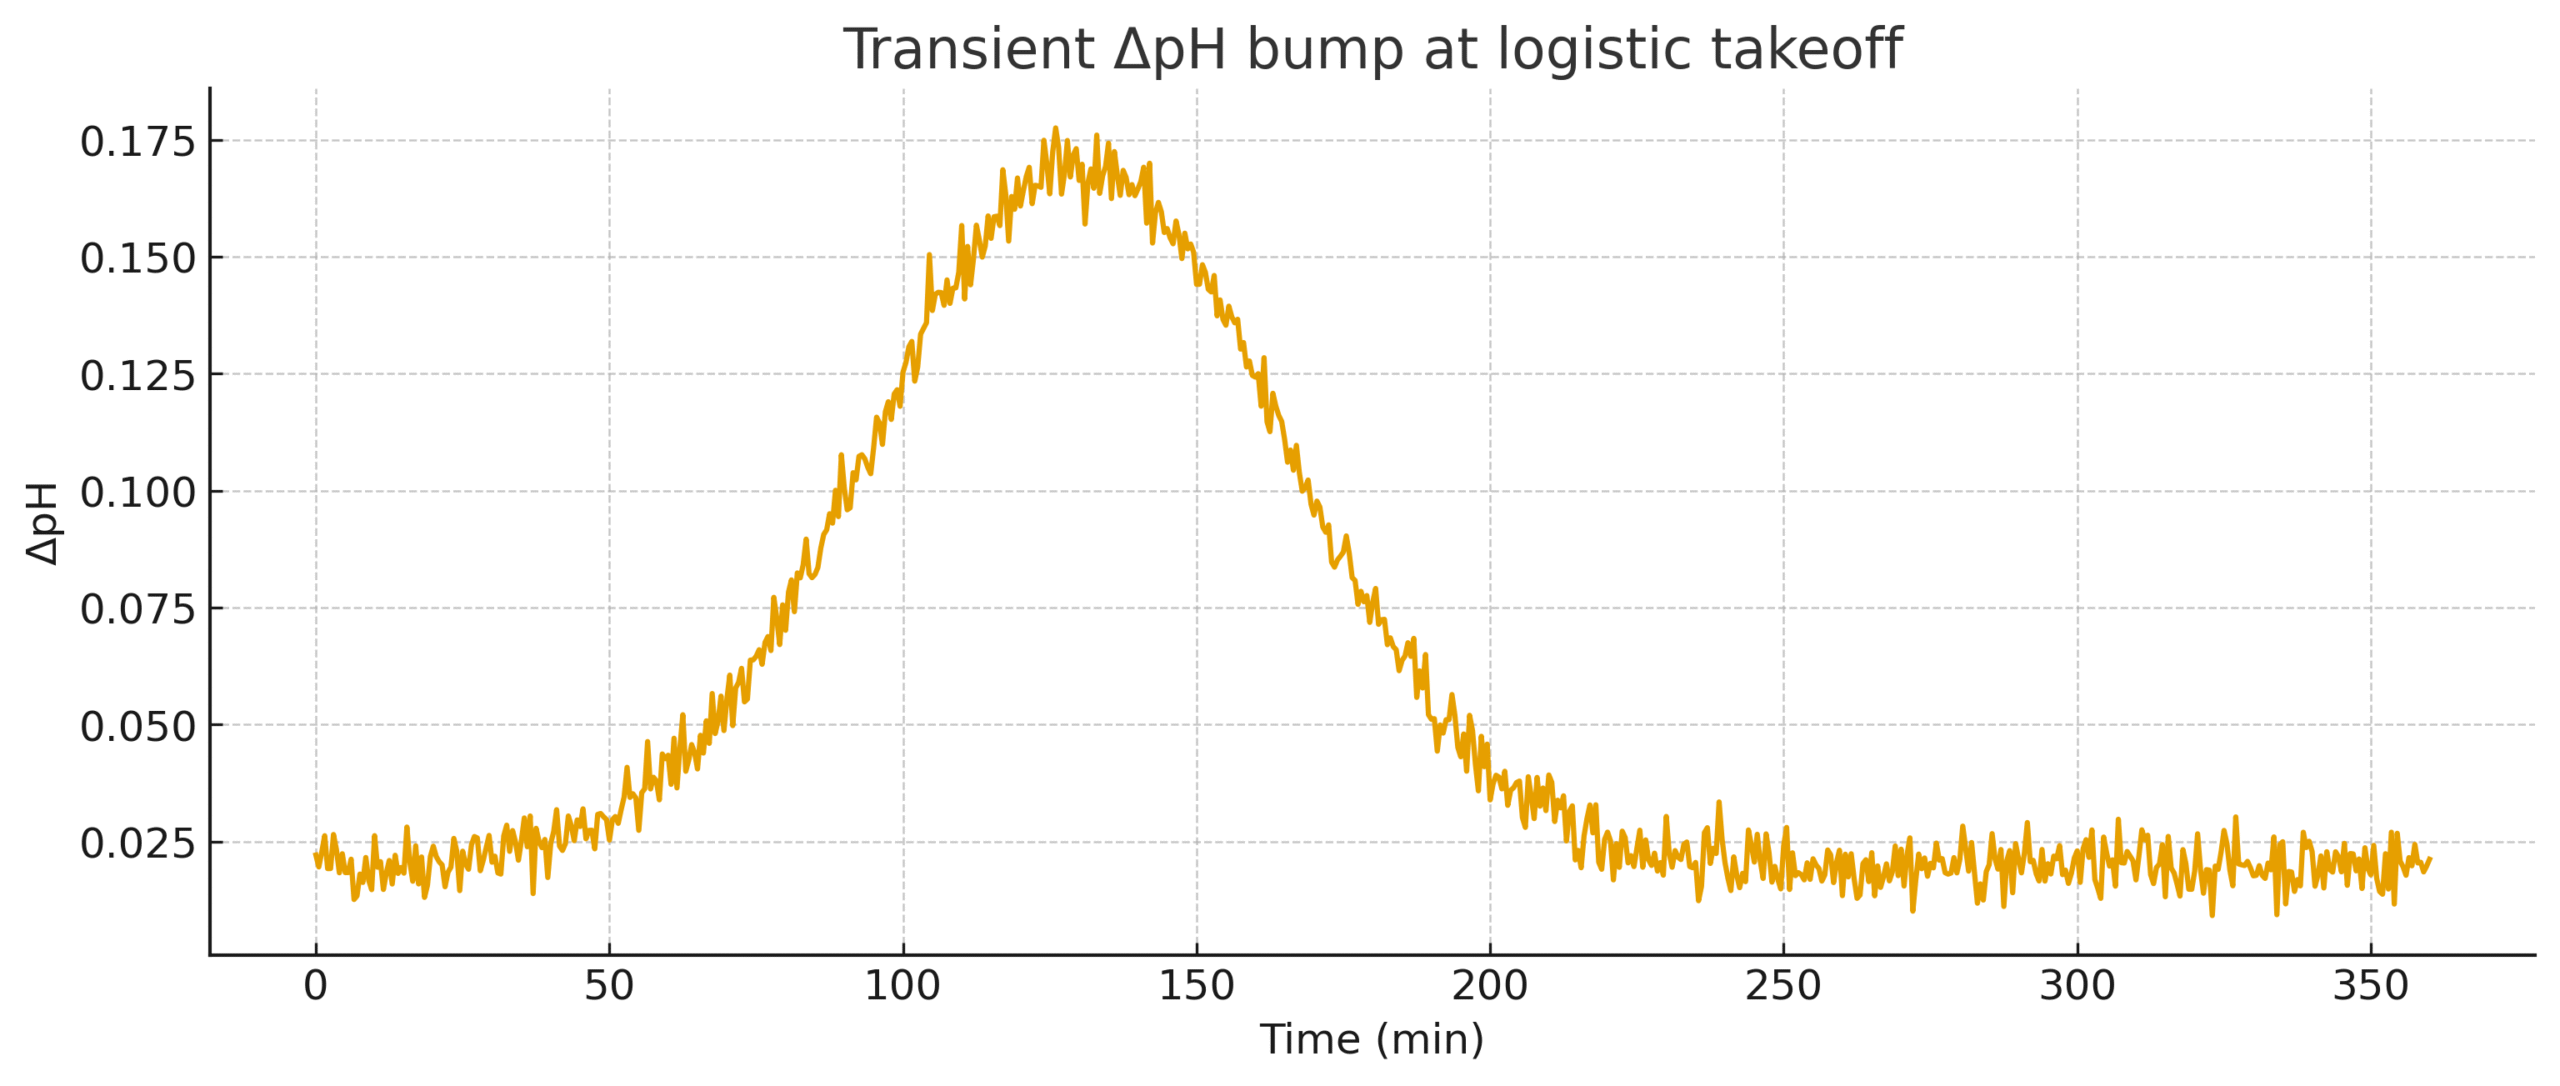
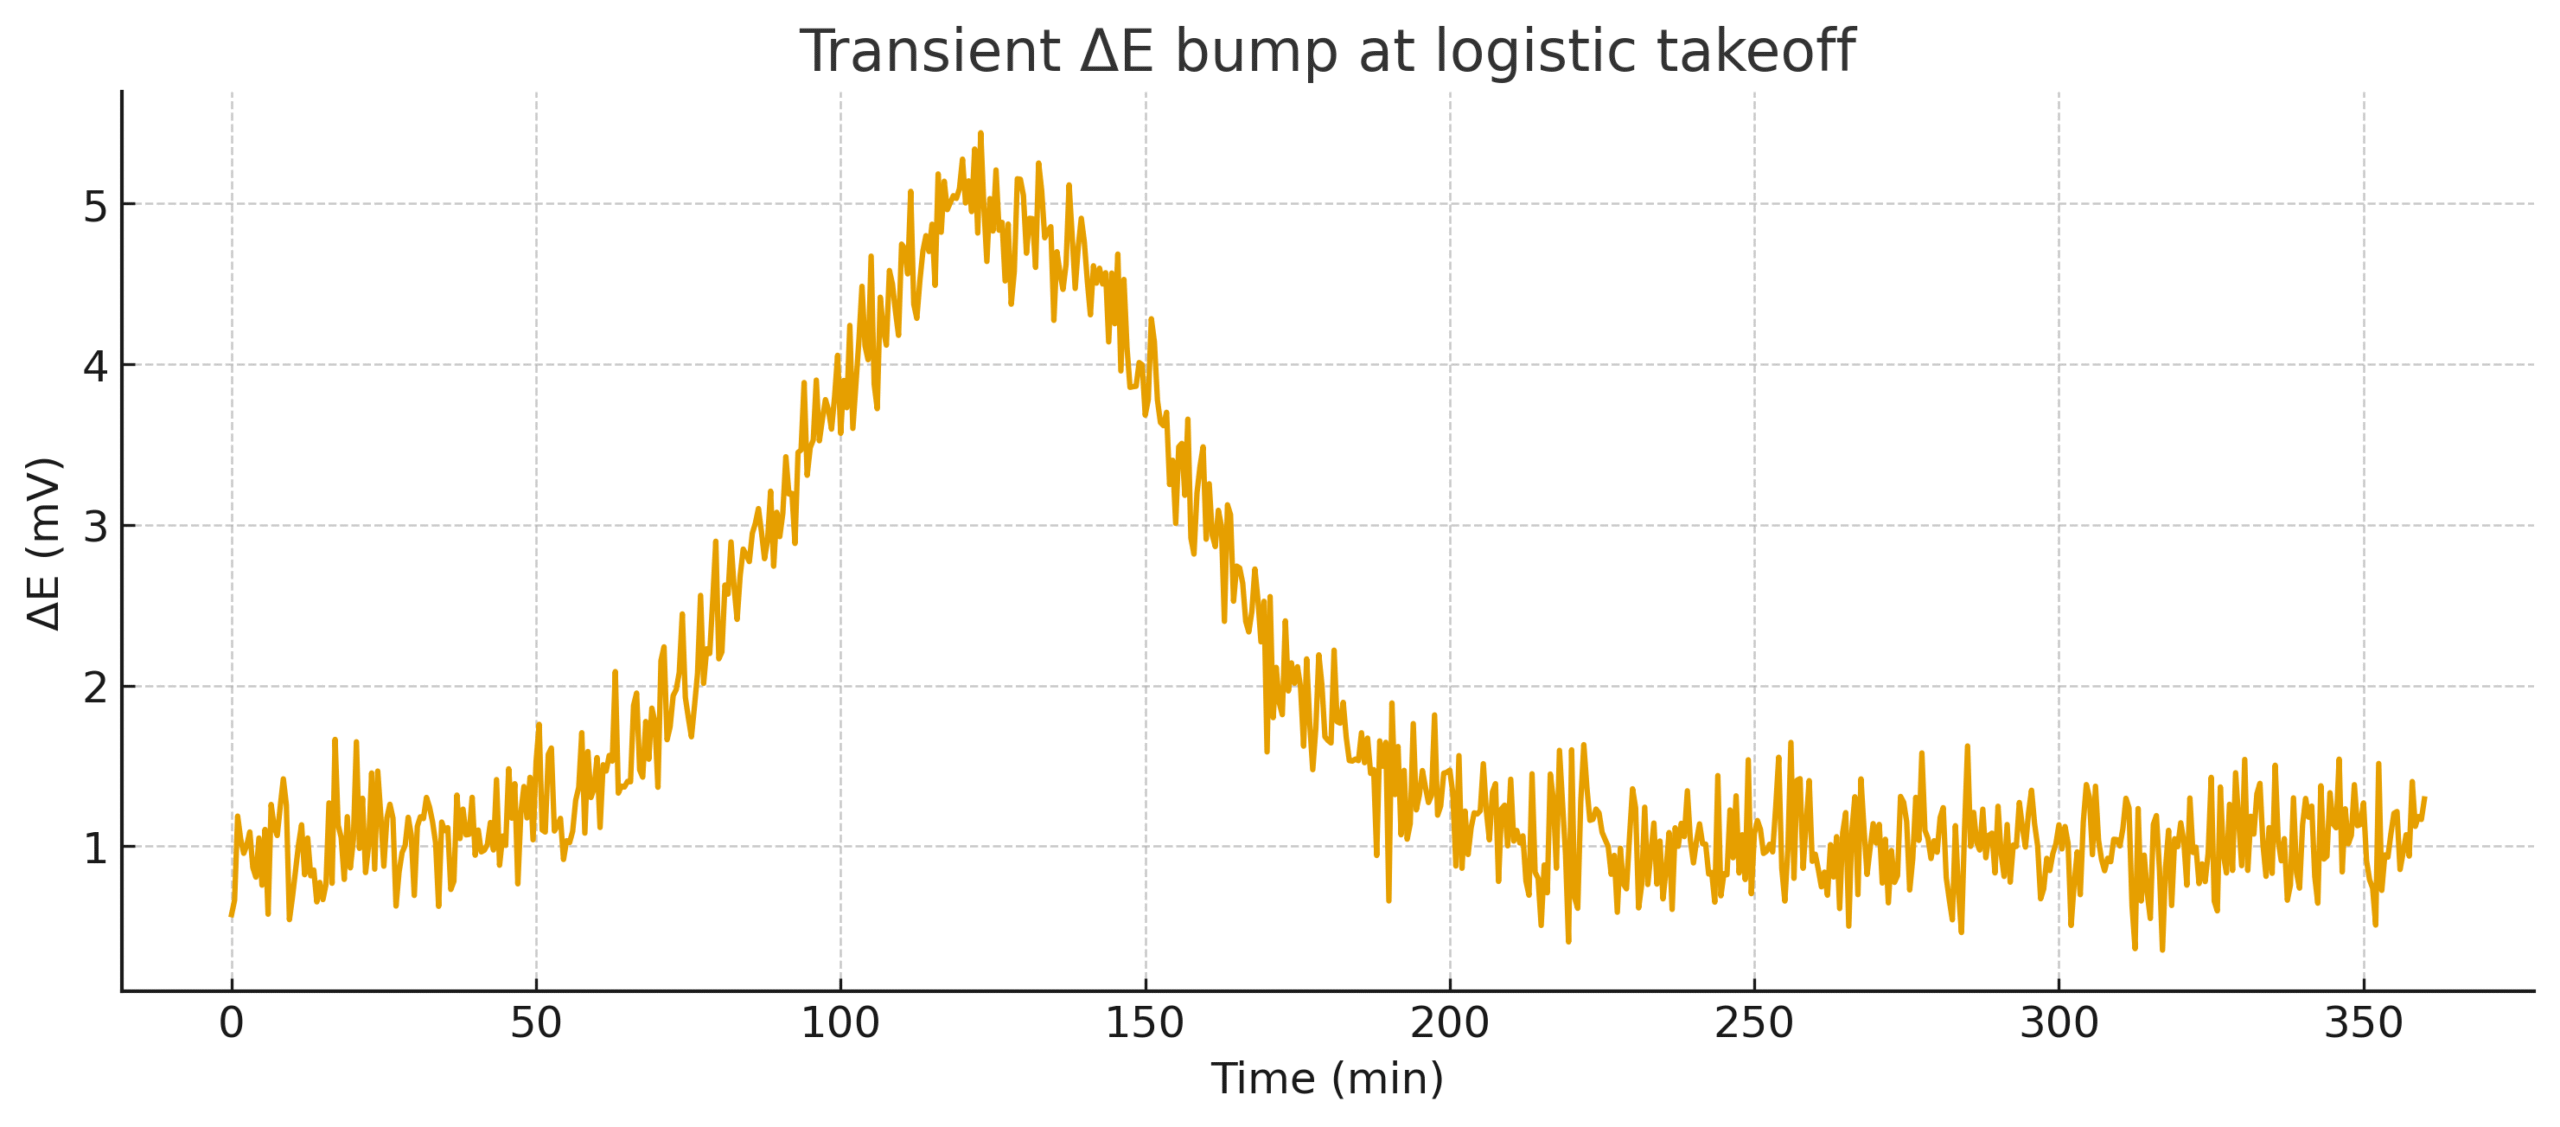
(iii) holding a small ΔpH/ΔE and
(iv) forming AcP/PPi. One dataset moves SoL/MVS from “best theory” to demonstrated mechanism.
Build
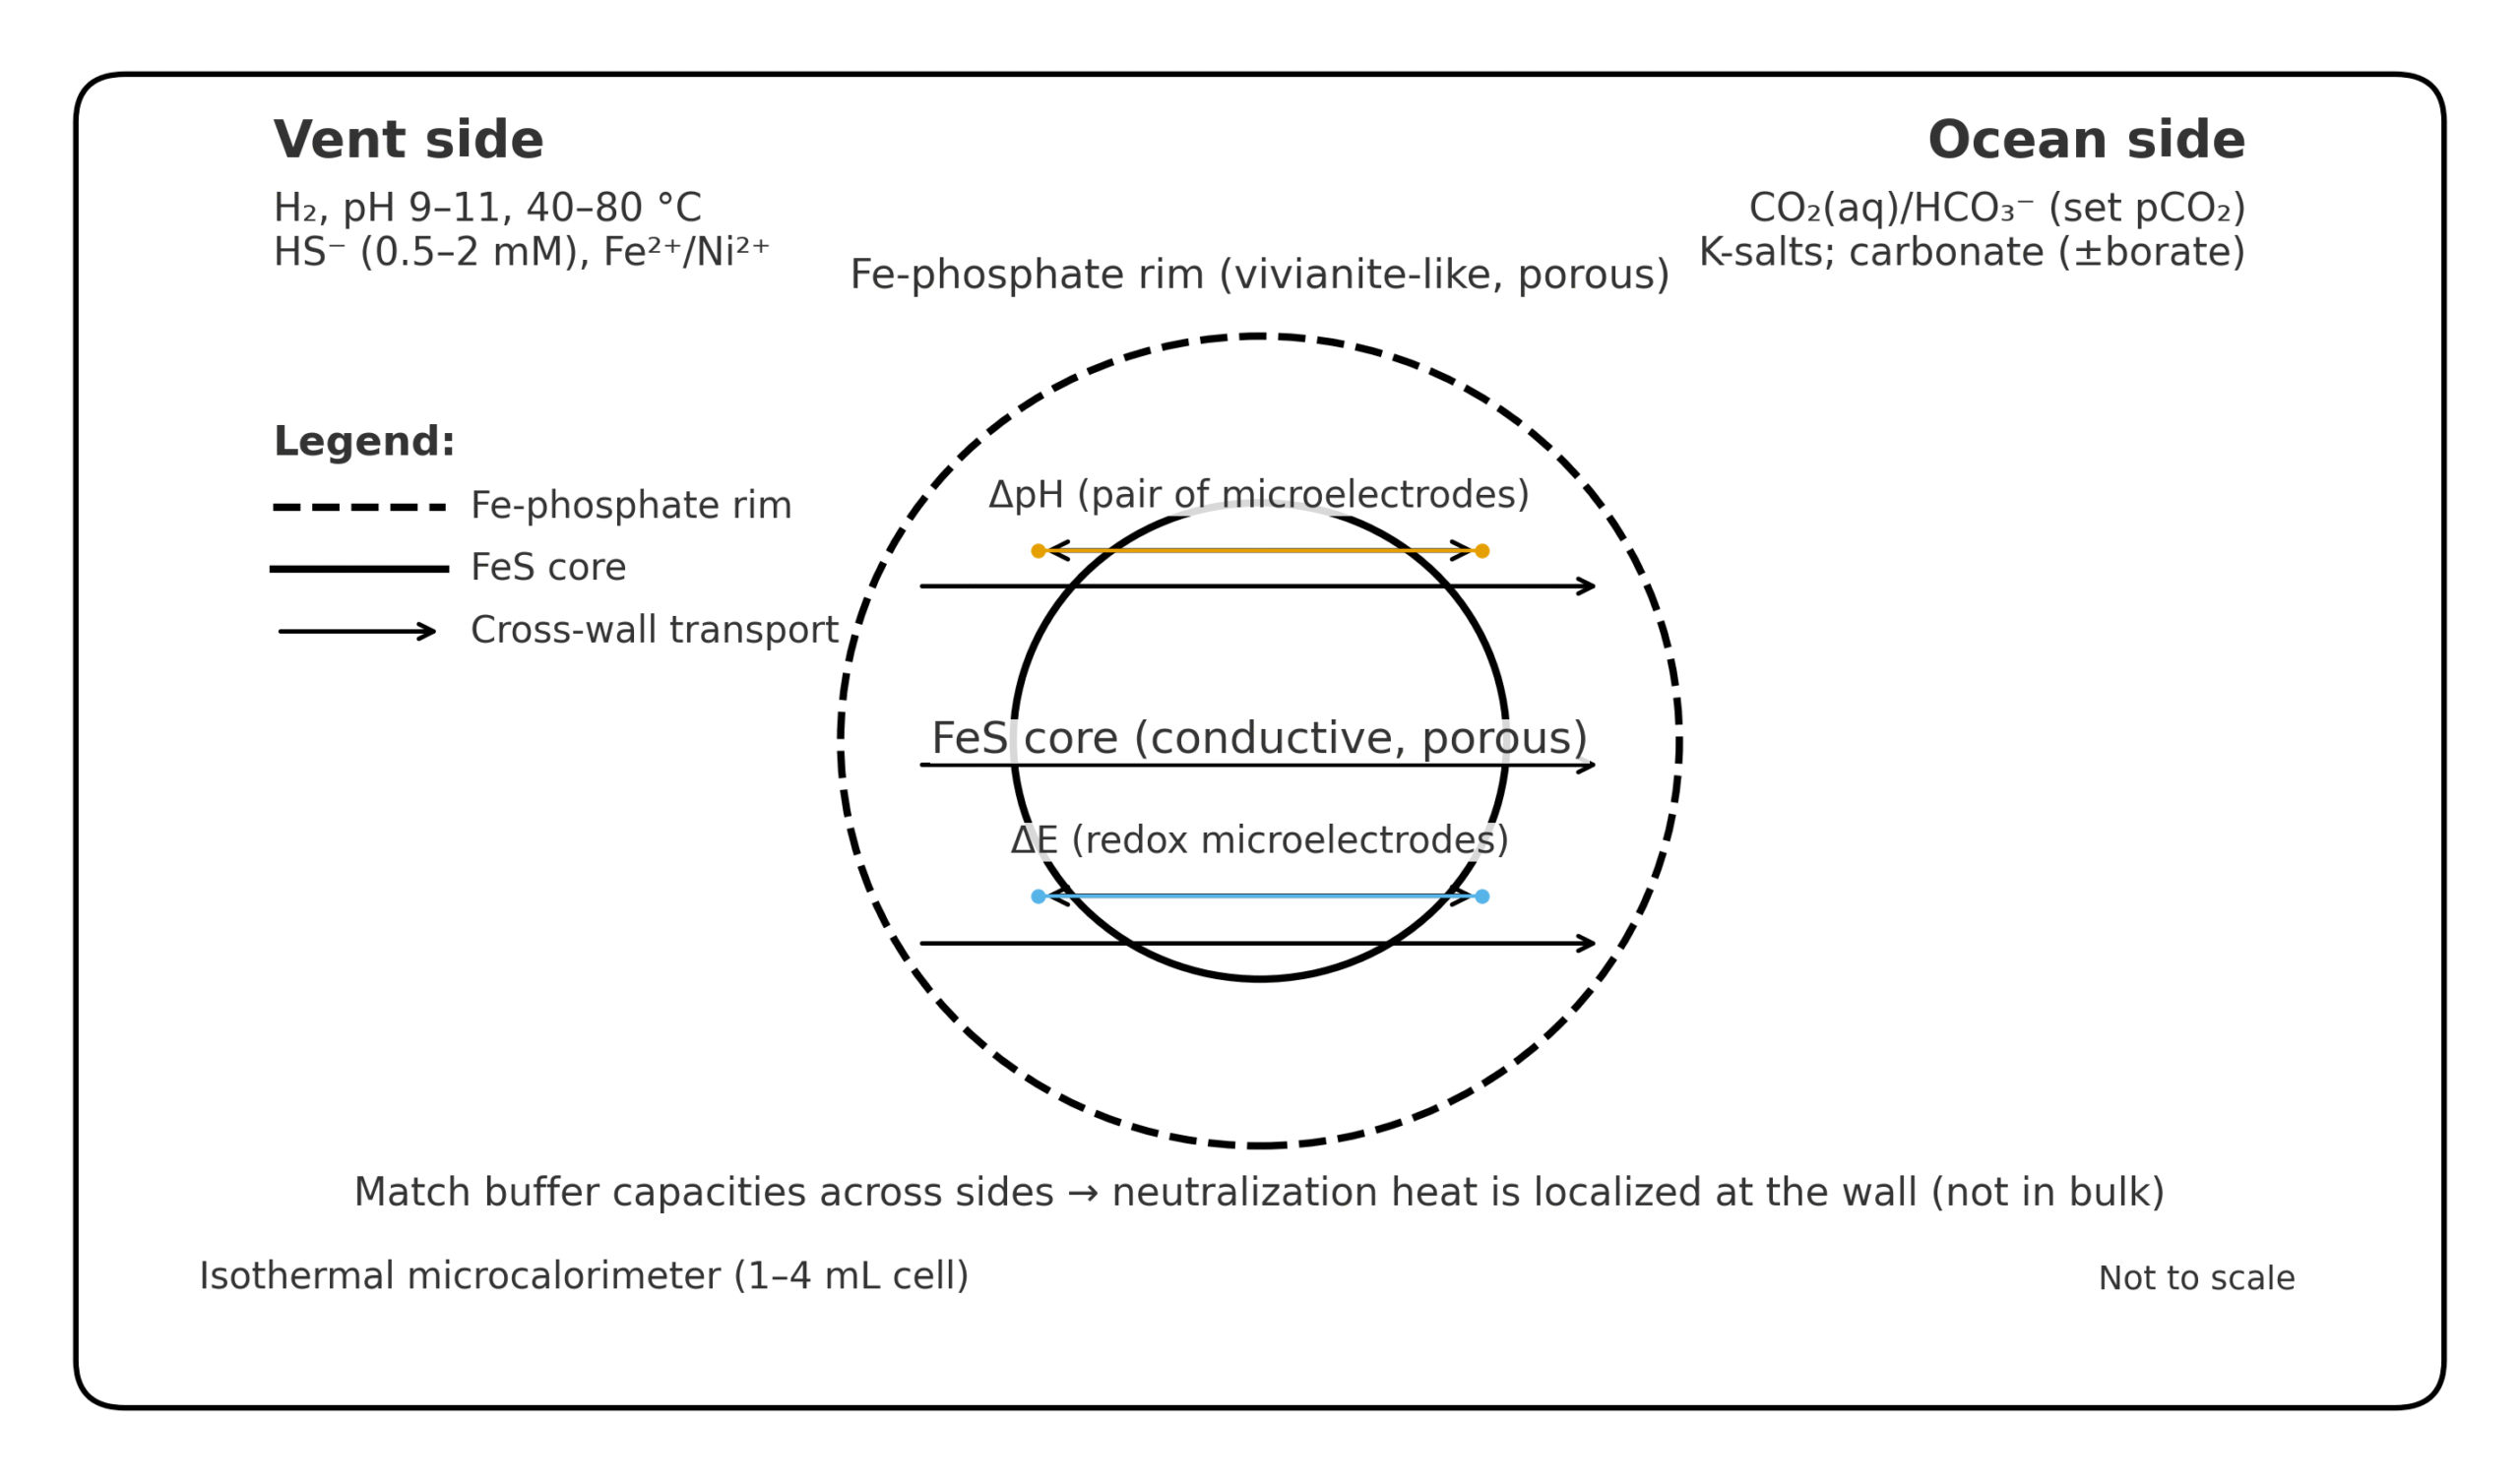
- Wall insert: Porous FeS (±FeNiS/greigite) core grown on a conductive scaffold; Fe‑phosphate rim (vivianite‑like) grown in situ by slow PO₄³⁻ perfusion. Keep 20–40% porosity; avoid pyrite glazing.
- Rim window (v1.1): anoxic N₂ headspace (dissolved O₂ <10 ppm); pH 6.8–7.4; Fe²⁺ 1–5 mM + PO₄³⁻ 1–3 mM; ≤40 °C; exclude sulfide during rim growth; monitor O₂ inline.
- Cell: 1–4 mL isothermal microcalorimeter (IMC) ampoule with μW sensitivity; the FeS/Fe-phosphate wall insert sits inside this ampoule
- Feeds (two sides):
- Vent side: H₂, pH 9–11, 40–80 °C, HS⁻ (0.5–2 mM), traces of Fe²⁺/Ni²⁺.
- Ocean side: CO₂(aq)/HCO₃⁻ (set pCO₂), K‑salts, carbonate (±borate).
- Buffering (v1.1): pH- and ionic-strength–matched (±0.05 pH; ±0.02 M I). Pre-titrate both sides; run neutralization-heat blanks so any residual heat lands at the wall, not in bulk.
Run
- Baseline 30–60 min with matched buffers (stabilize IMC drift).
- Start gradients: H₂ perfusion on alkaline side; CO₂ on the other; hold T.
- Sampling at 0, 10, 20, 30, 45, 60 min; then every 30–60 min (products + currencies). ΔpH/ΔE and IMC logged continuously.
- Controls (parallel): Blank wall; H₂‑off; CO₂‑off; ΔpH‑collapsed; HS⁻‑off; heat‑killed wall; plus chelator‑poisoned and brief O₂‑passivated wall.
- If passivation detected (early plateau or IMC uncouples), brief sulfite rinse to re-condition the rim, then resume the run.
Pass / fail (pre‑registered)
- Kinetics (primary): Σ(C₂–C₄) logistic fit beats linear/mono-exp (ΔAIC ≥ 10; report R²).
- Heat coupling (primary): IMC co-rises with dΣ(C₂–C₄)/dt (cross-corr ≥ 0.6; lag ≤ 5 min).
- Currencies (primary): AcP or PPi ≥ 3σ above blank (³¹P-NMR primary ID; Raman/enzymatic confirm).
- Gradients (supporting): transient ΔpH ~0.1–0.2 or ΔE ~3–5 mV bump during takeoff (non-gating).
- Label (required): [1,2-¹³C] acetate isotopomer observed in a ¹³CO₂ run
- Controls: No logistic/heat coupling in any negative control.
Numbers to expect
- 4 mL · 1 mM formate over 1 h → ~6.9 µW average (peaks higher during logistic takeoff).
- 4 mL · 0.1 mM acetate over 1 h → ~24 µW average.
- 1 mL · 25 mM formate over 1 h → ~43 µW average.
IMC floors are μW‑class in these cells; logistic takeoff boosts instantaneous peaks above the averages.
Evidence checklist
☐ S-curve Σ(C₂–C₄) (same wall) — logistic > linear (ΔAIC ≥ 10; report R²).
☐ IMC exotherm couples to dΣ(C₂–C₄)/dt — cross-corr ≥ 0.6; lag ≤ 5 min
☐ ΔpH / ΔE bump at takeoff — ΔpH ~0.1–0.2 or ΔE ~3–5 mV.
☐ AcP/PPi detected — ≥ 3σ above blank (³¹P-NMR primary; Raman/enzymatic confirm; citrate quench to suppress Pi artefacts).
☐ Controls flat — no coupled S-curve + exotherm or currency formation.
Target readouts — what “good” looks like
Products (IC/LC/GC-MS): Σ(C₂–C₄) time-series should fit a logistic S-curve better than linear/mono-exp (ΔAIC ≥ 10; report R²). Typical plateaus in a 1–4 mL cell: acetate ~10–1000 µM, ±pyruvate in the µM range. Formate (C₁) is secondary (report for mass balance, not gating).
Figure: “Sigmoidal CO₂→C₂–C₄ (example logistic).”
IMC heat-flow: A µW-class exotherm that co-rises with dΣ(C₂–C₄)/dt during takeoff; peak often ~5–20 µW above a ~0.5–1 µW baseline in 1–4 mL cells. Report cross-corr ≥ 0.6 and lag ≤ 5 min vs dΣ(C₂–C₄)/dt.
Figure: “IMC exotherm (tracks dΣ(C₂–C₄)/dt; µW scale).”
ΔpH & ΔE transients (supporting, non-gating): Small, time-aligned bumps at takeoff: ΔpH ~0.1–0.2 and ΔE ~3–5 mV, decaying as the system relaxes.
Figures: “Transient ΔpH bump …” and “Transient ΔE bump …”.
Currencies (³¹P-NMR/Raman): AcP or PPi ≥ 3σ above blank (LOD-based pass). ³¹P-NMR is primary ID; Raman and/or enzymatic mapping confirm. Use a citrate quench in AcP runs to suppress Pi false positives.
Isotope label (required): Run one replicate with ¹³CO₂ feed (≥50 atom %). Report product ¹³C atom % and isotopologue distributions for formate/acetate/±pyruvate after blank subtraction. Success criteria (labeled run): product atom % ≥ 0.7× feed and acetate shows excess M+2 consistent with C–C coupling.
Controls: Negative controls (blank wall; H₂-off; CO₂-off; ΔpH-collapsed; HS⁻-off; heat-killed; chelator/O₂-passivated) must not show the coupled Σ(C₂–C₄) S-curve + IMC exotherm pattern or currency formation. Any control reproducing the coupled signature invalidates the claim.
